BalancingandWIPtracking
Balancing and WIP tracking

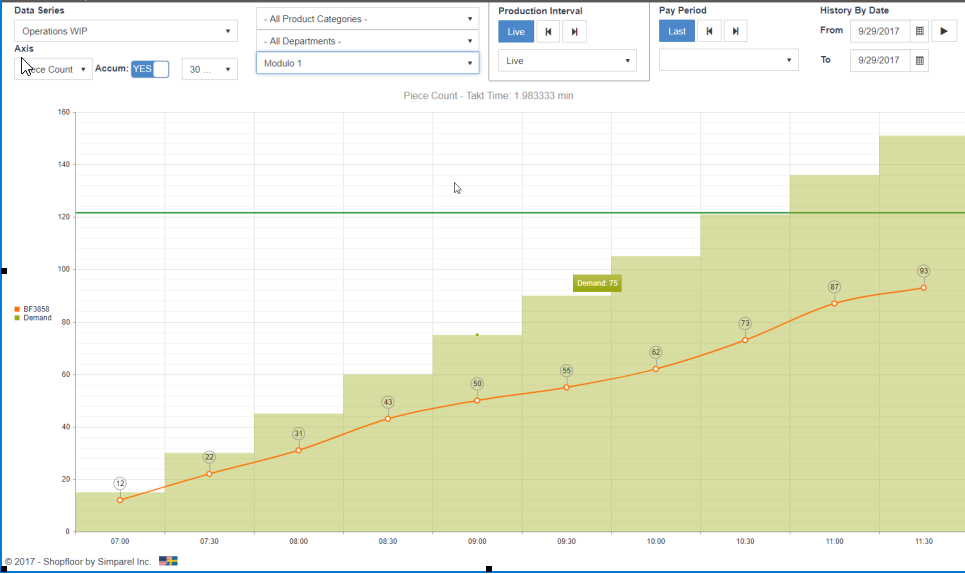
The Target screen in Shopfloor features a lot of visual feedback as operator performance, off-standard levels and quality reports. An important feature is tracking WIP related to demand and being able to spot bottle necks. The support for WIP tracking in Shopfloor is endless and any number of operations from the Bill of Operations can marked to be used for WIP tracking.
Looking at the sample above we are producing a product called pants which contains over 70 operations. The data on the left of the screen shows the 5 strategic operations that have been selected for WIP tracking. TAG & BOX has been switched off on this screen.
In this case the data in the 'Axis' box (at the top left of the screen) has been set to an interval of 30 minutes and to show accumulated piece count. Accumulated is the sum of product over the period. 10 in hours 1 and 2 will show 20 in the accumulated view in the second hour. Non-accumulated would show 10 in each hour.
In the department filter, department 200 has been selected, and that has a current takt time set to 0.56 minutes. So demand, represented by the ascending 'stairs' on the graph, is increasing by 53-54 pieces per 30 minutes. In this case we are looking at a full day, but the data is obviously available from the first second of the ongoing shift.
Analysis
The bigger the gap between the WIP tracking operations, the greater imbalance in production since the operations were chosen since they have to be in sync to show that the product is complete. For instance, the surge and sewing operations must be equal. When production is well balanced, all lines over lapping each other or running very closely.
In the same screen you can also spot both over capacity or under capacity since the closer to the “Demand stairs” you are, the better you meet customer demand.
The accumulated over/under production for each operation is showed in the bubble on the last interval.
Your 2-click action plan for production imbalances
Click once for details on any operation in the graph. You will get a break down by operator at that operation. Their production counts and average performance:

Then click again on “Users with skill” to get operators with skill for operations similar to this, or …

… click on any operators “Skills” button to see where else they could possibly help.

More options
Takt time can be set by Department - normally a production line, by Team – normally a work shift or by Product Category – Grouping products of similar kind. So even in a mixed production scenario the analysis above can be made. Obviously breaks and scheduled off-standard intervals are skipped over in the Demand calculation.
Data Series can show WIP key operations as above or all operations. It can also be used to show the data by operator or location, or completed units by team or department.
Axis selection is used to switch between piece count, accumulated piece count, efficiency or cycle time. Time interval can also be changed here, from 15-minute intervals up to weekly summaries can be made.
Book mark and big screen your favorites. Since Shopfloor is running in any web browser and all the selections you make can be stored using a simple bookmark you can easily get back to the same screen with the same selections every day. This is also very useful if you want to plot the information on a big screen, making all your operators aware of the overall balance and pace.
Copyright © 2020 by Aptean. All rights reserved.
Created with the Personal Edition of HelpNDoc: Full-featured Help generator