TrackingwithWIPandTakt
Tracking with WIP and Takt
Looking at the piece count for all operations, it is a bit tricky to analyse out put in a simple manner. This is what it could look like. It basically just visualises what has been done at spreading and cutting, not much more.
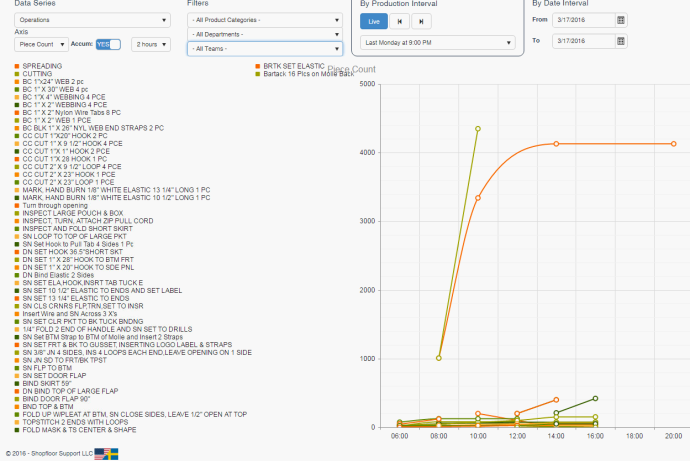
This is of course a pretty normal situation in sewing since the variety of products and operations are wide. There are a couple of filters that can be used on the target screen to help.
Teams - can be used to show what groups of people has produced.
Departments - can be used to show what production has been made on groups of locations/tablets.
NOTE the difference here. If a user from the Team Cutting Room “helps out” at an operation in sewing, the production data for those records will still be shown under Cutting Room if using team filtering. If using Departments, data is shown in relation to the location where it was produced, that way the production made in a specific department shows there regardless of “who” made it.
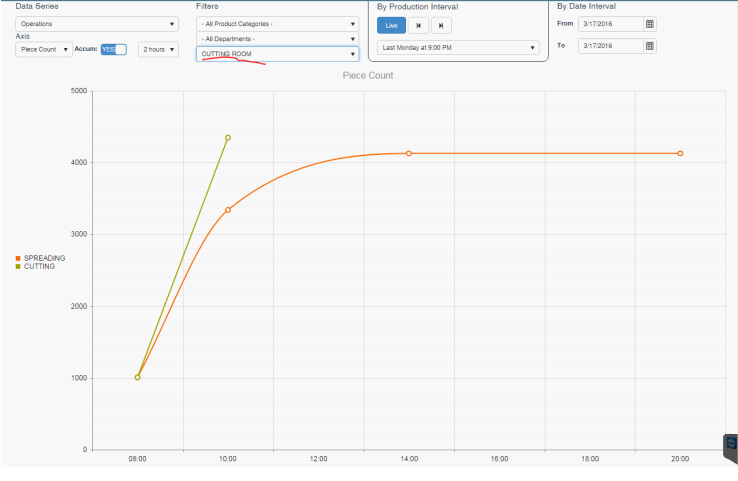
But let’s use Teams for now. This is CUTTING ROOM, looks pretty OK already since there are only 2 operations.
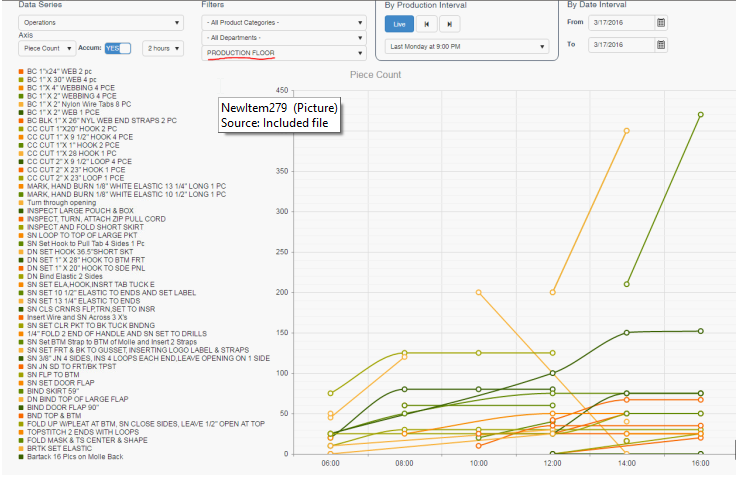
This is PRODUCTION FLOOR, still pretty hard to get meaning full output.
So next step is to identify the operations that is meaningful to measure. In many Product definitions, the first operation is marked as WIP start and the last operation is marked as WIP end. This is a good way to be able to track Work orders. See when they have been started and see when they have finished. But in cases like above that last operation might be a Shipping operation that is used when packing and finalizing the shipment and therefor the operation is reported in bulk, every other day or so. It is also possible that the Shipping is done in a different Department than Sewing, that makes it impossible to use for tracking the output of sewing. Since Shopfloor allows any operation in the operation list to be selected for WIP tracking we can use this to find the common operations that are the last ones to be used in sewing area. In this case it is the inspection operations. So after setting up all operation lists with WIP flag on the inspection operation we can use the “Operations WIP” selection in targets - we get this:
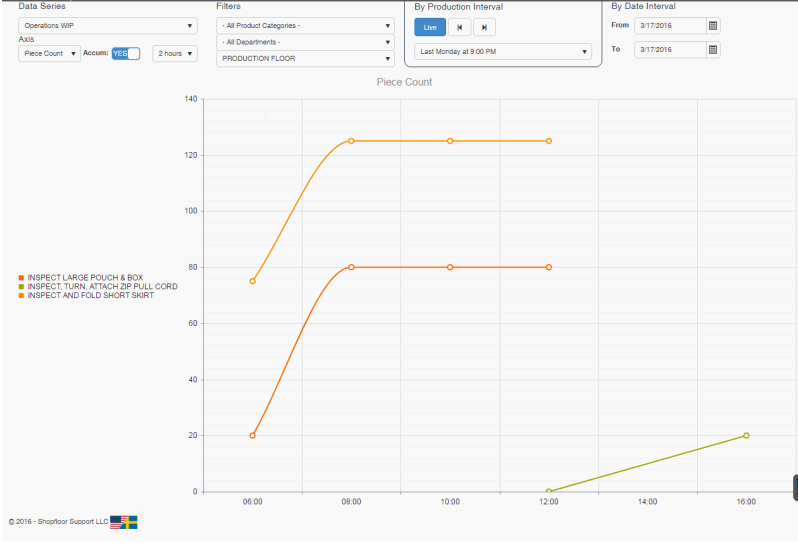
Today there has been 3 different inspection operations used. Probably since there has been 3 different products in production. But we want to have the total output. To achieve that we can setup all the inspection operations to be grouped into the same “Category”. This is done in the Manage Operations section.
So after creating an Operation Category “Inspection” and then having mapped all the inspections to this category we get a single line output:
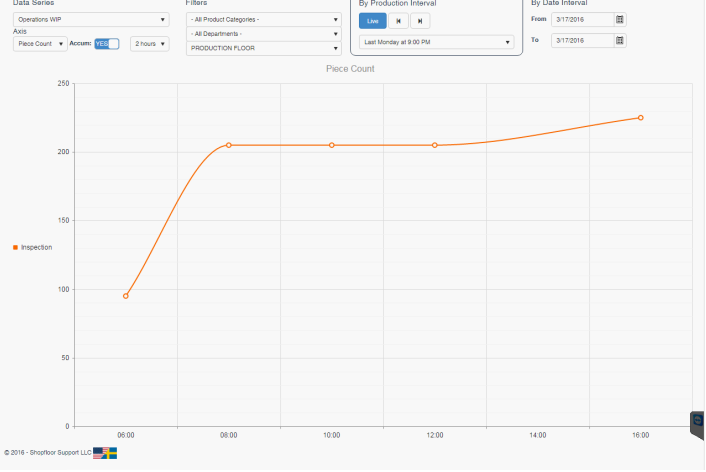
225 pieces has left the production floor this day. Let’s switch to another day and hourly interval to see some more output and look at takt time.
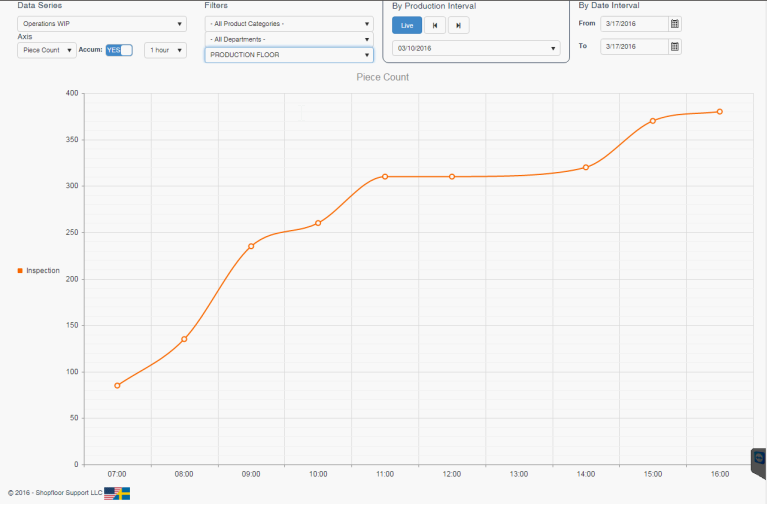
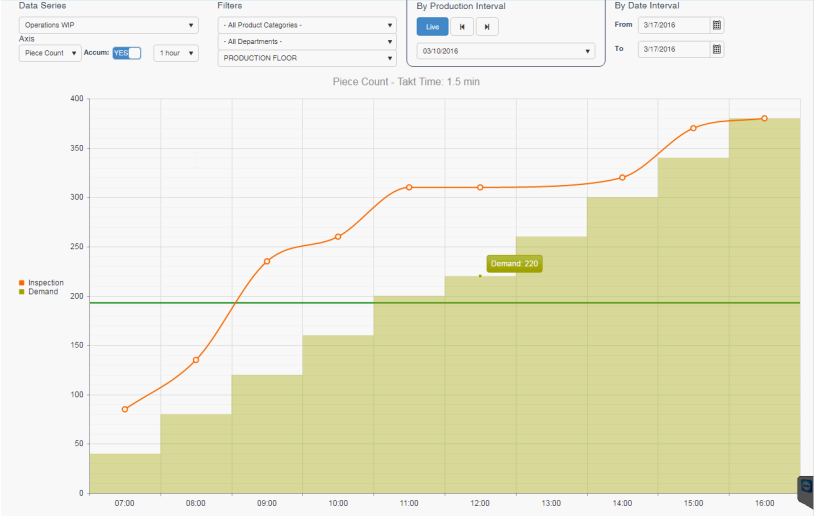
Takt time is defined as the available time (net time) / demand (customer demand). Normally expressed in minutes. So we can use this to compare the output to what number of pieces is required. For example, if we normally work from 07-17 that minus a 30-minute break, that is 570 minutes. If today’s target for production is 380 pieces, the takt time is 570/380 = 1.5 minutes. Or to put it in other words 1 piece should be finished every 1.5 minutes. Set it up for the Team. Takt time can also be defined for Departments.

Now if we go back to the target screen we have this:
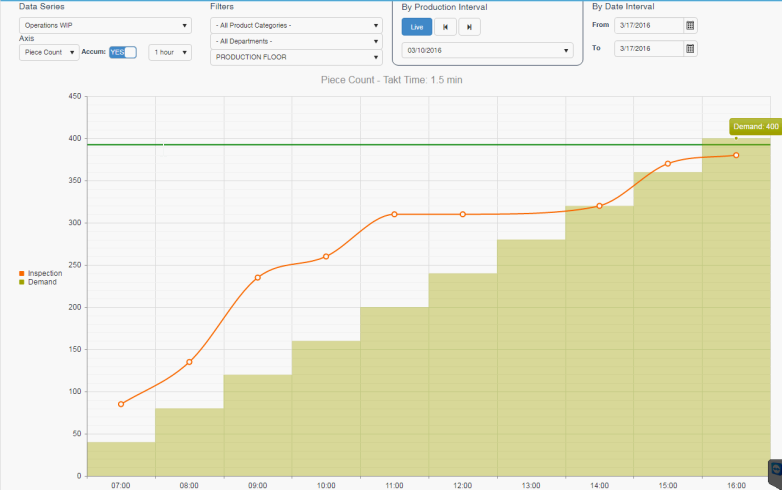
But what’s that? The Demand ends at 400, we missed by 20 pieces. Right, the break. We need to schedule it. Add a 30-minute break at 12:00. Do this from the Manage - Schedules menu
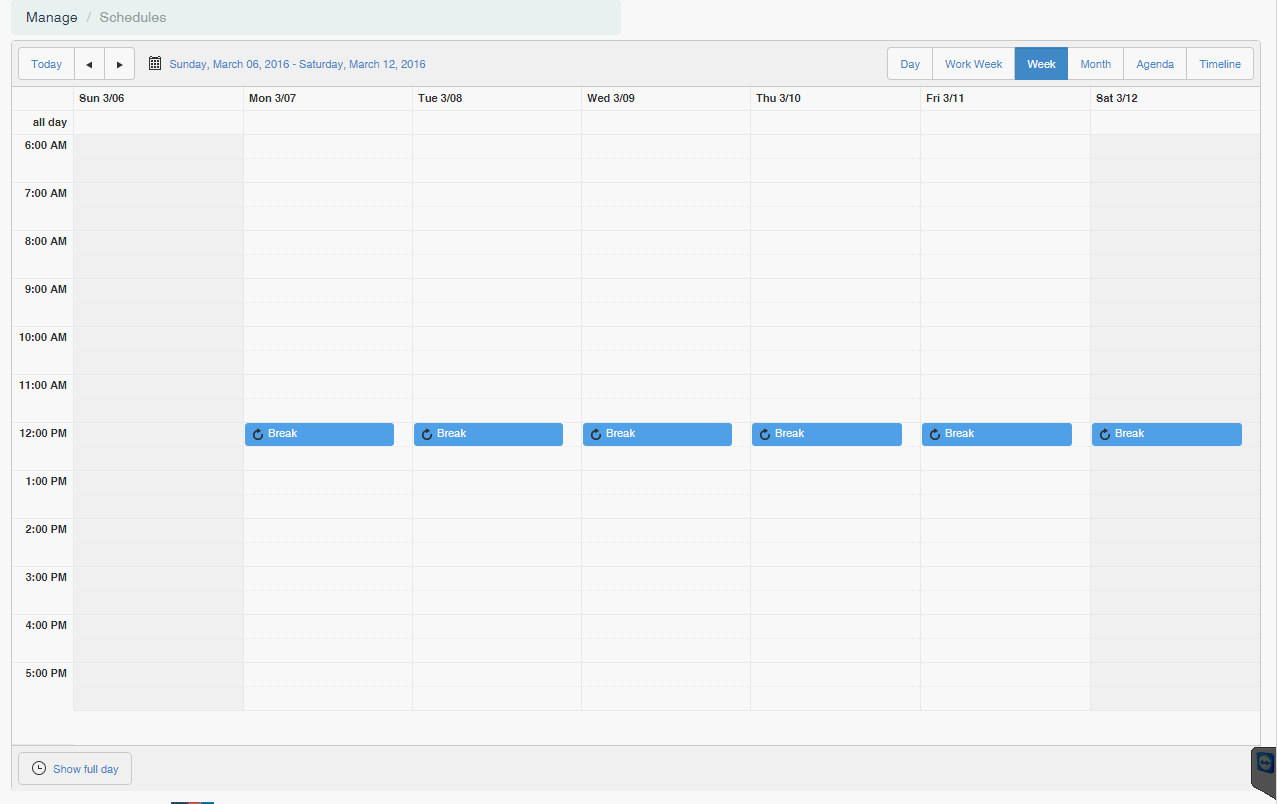
That’s better. Notice how the demand only increases by 20 pieces at the interval between 12 and 13.
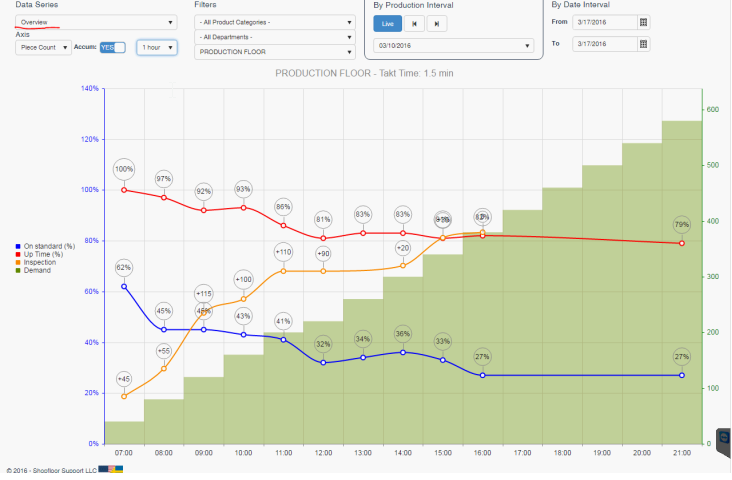
Finally, we can use the “Overview” to plot both the output from the sewing area together with On Standard Efficiency % and Up Time % in the same graph. The % relates to the left Y-axis and the counts relate to the right Y-axis. The time scale in this one is extended to 21:00 since one or two operators forgot to sign out…Still you can see the Inspection line ending up on demand at 16:00.
Copyright © 2020 by Aptean. All rights reserved.
Created with the Personal Edition of HelpNDoc: Experience the Power and Ease of Use of a Help Authoring Tool