Users1.html
- Welcome To Exenta Shop Floor Control
- Exenta Shop Floor Control Web Application
- Menus
- Live Production Menu
Users
Live Production Users
Definition and Functionality:
Live Production > Users
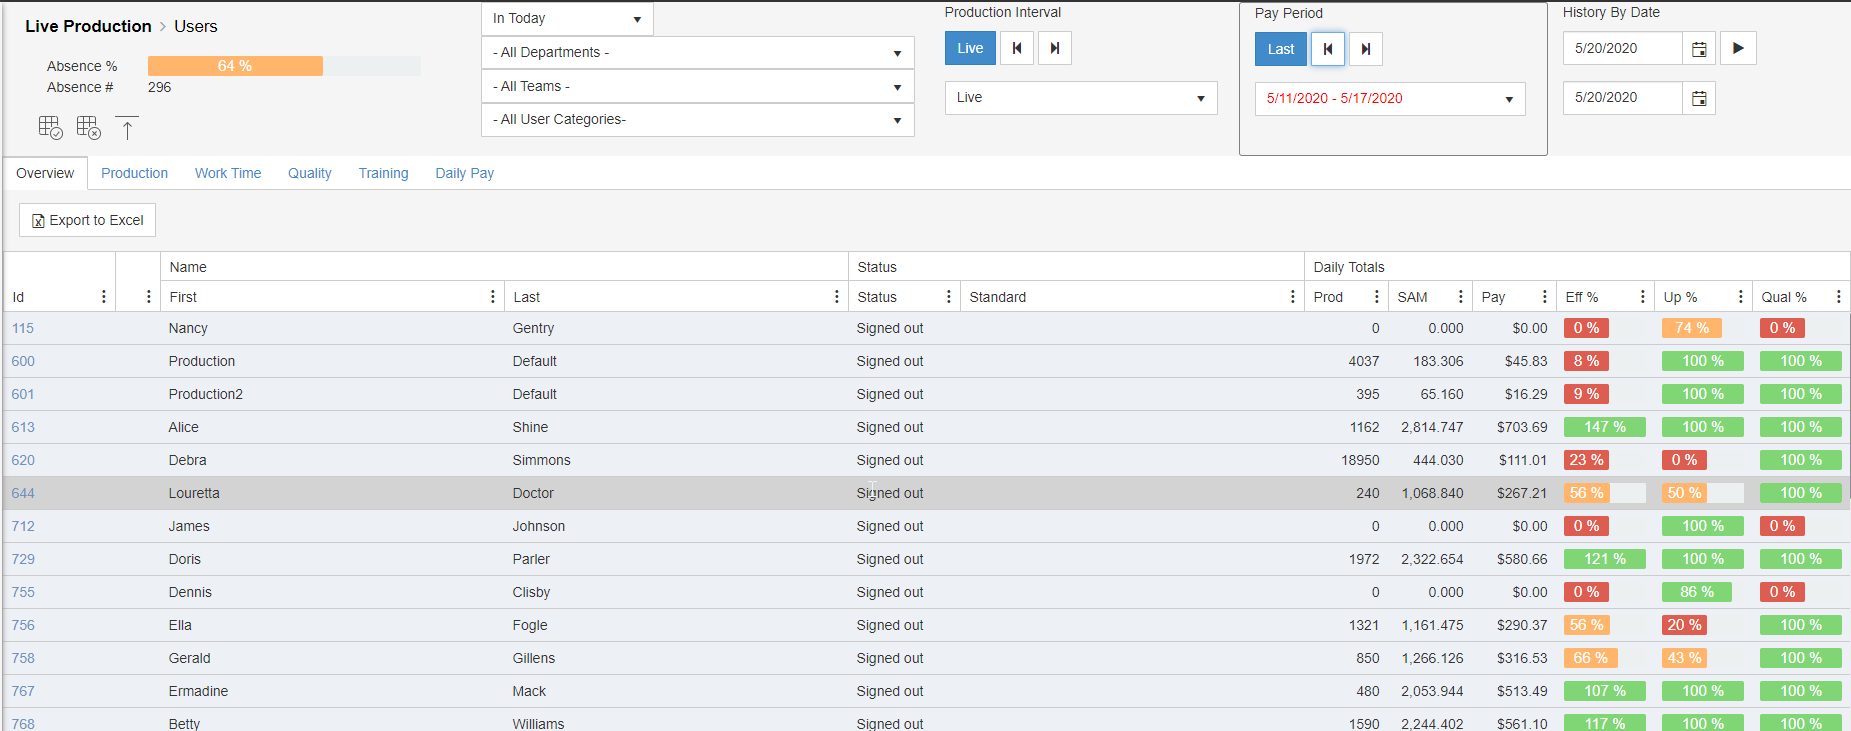
The page shows the real time and historical data for the users. It also shows different types of KPIs that users perform during the day and historically. It shows the status of the user and where the users are performing their work.

Stats Tabs and Status:
The tabs shows different type of data related to the user, from placement to payment. Each represents a type of measuring that could be traced and evaluated by management.
Overview:
The overview shows the Total KPI by user with lean manufacturing practices.
- Status – Shows the state of the user, i.e. working, off standard, etc.
- Production – Shows the total units made.
- SAM – Total SAM earned.
- Pay – Total Piece Rate earned.
- Efficiency – Real time efficiency.
- Up Time – Total percent of time worked in an on-standard category.
- Quality – Total percent of defects over total production.
Production:
This tab is designed to show in real time where the user is working and what operation is performing and the link to the product, work order and specific work order unit.

Work Time:
This tab shows the efficiency, SAM and time in different categories. Total hours, SAMs and efficiency, on standard, SAMs and hours and efficiency, off standard time and SAMs and break time. In real time shows the time of the first clock in of the day.

Quality:
This tab shows the quality stats of the user based on the production performed in real time and historical data. This screen show the percent of quality, audit and repairs.
- Audit – A sample size of a unit to report quality
- Defect – Errors made during product manufacturing or material defects such as shading, holes, pulling or loose yarn.
- Repairs – It is a solution to sewing defect to upgrade to a first quality product.

Training:
This a Real Time function to measure trainee users during the day.

- Training Curve – ID and name
- Level – Level of the training curve with parameters to measure the growth of user development.
- Goal – The efficiency goal for the level of the curve
Daily Pay:
This screen show the outcome of the gross pay calculations by day, period or range of dates.

User Details:
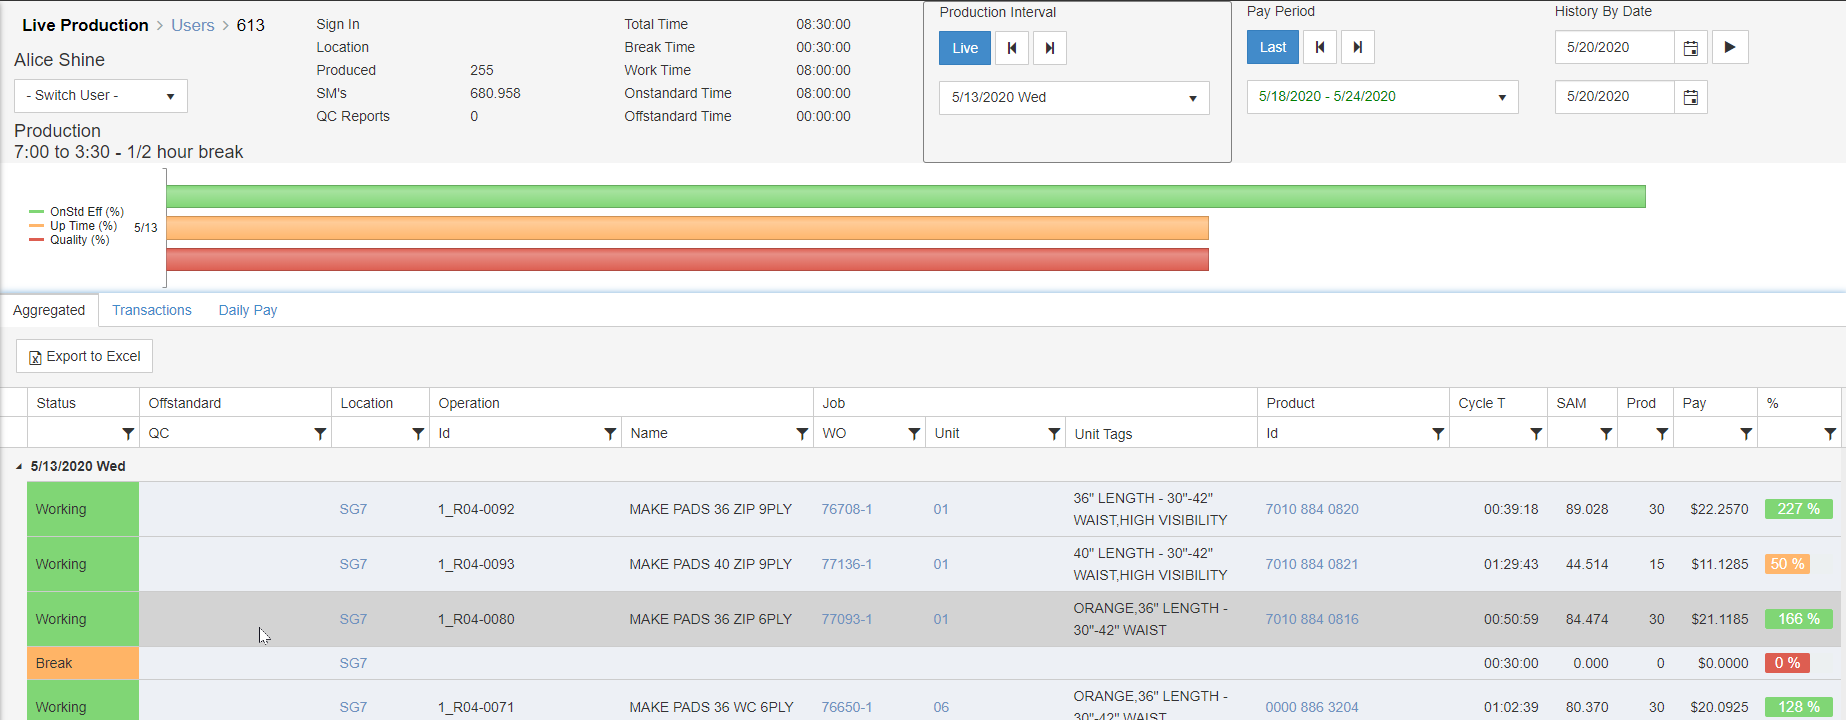
Clicking on a user ID takes you to a detailed user view that shows your live production with filters for historical data. Contains user statistics for the time period.
Everything you need to know about employee statistics, aggregate operation performed, user transactions, and payment.

Key Data:
The screen contains important data to help measure the user during a period of time.
- Time Stamps – Time stamps tell information about specific time or cycle times, i.e. sign in time, work time, break time, etc.
- Production – Information about produced quantity, SAM’s earned and quality reports.
- KPI’s Graphs – Visual graphical data to show the user KPI’s, i.e. on standard efficiency, up time and quality.
Tabs:
- Aggregated - Aggregated list of all operations performed during the selected time frame and operation time, pay and efficiency for each operation.
- Transactions – All user transactions during the select period of time
- Daily Pay – The users accumulated pay for the selected time period. Used only with Incentive Pay module.
Copyright © 2020 by Exenta. All rights reserved.
Toggle navigation