Quality
Quality
Live Production Quality
Quality reporting KPIs display quality monitoring statistics throughout the manufacturing process. QC codes can be tracked by user or operations. There is a tab that contains all QA transactions, including visualization.
The standard calculations we follow for quality are as follows
Quality % - Based on first pass production quality = Goodpeices / Total Production
AQL Quality - Based on defects compared to audits = (Audit Count - Defect Counts) / Audit Counts
Quality
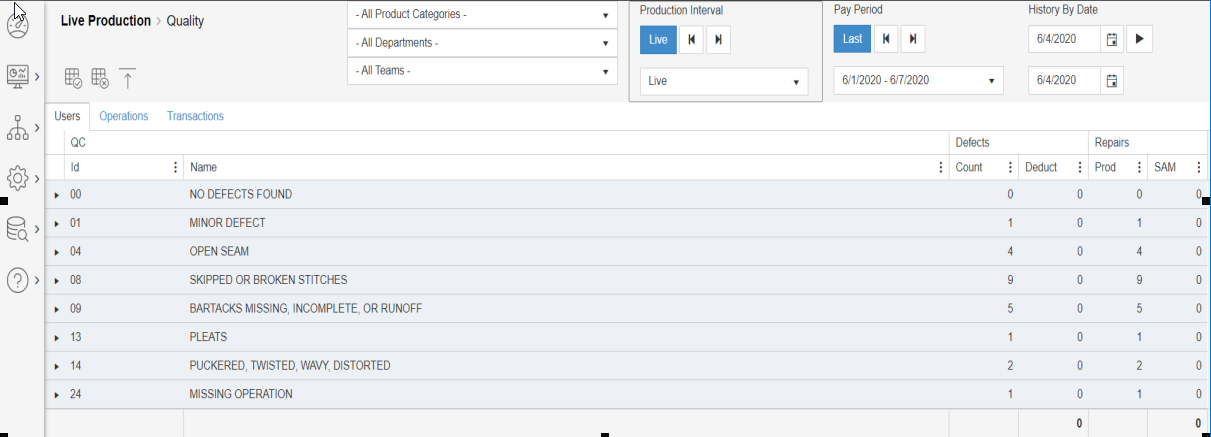
Live Production > Quality
This screen displays the data based on the quality control codes produced during manufacturing. Tracks statistics on defects and repairs based on quality code settings.
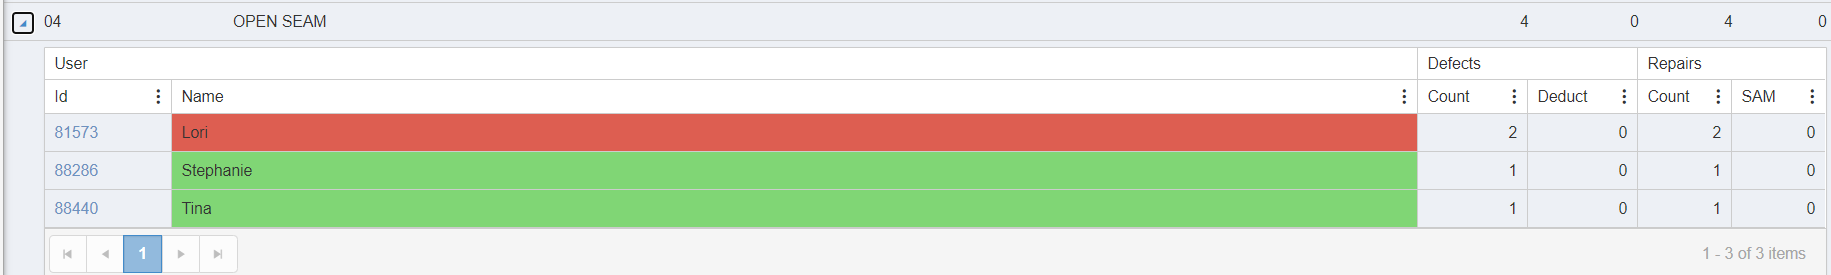
Quality Users
The system groups all defects by code and can be detailed by all users.
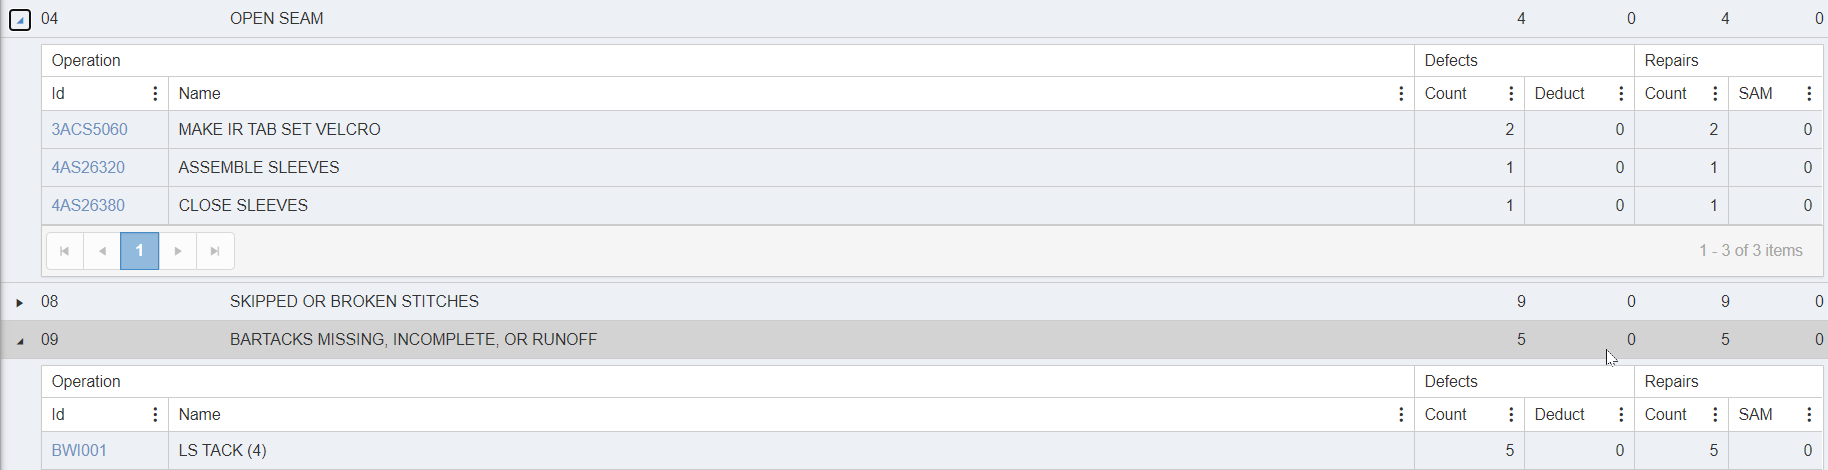
Quality Operations
The system groups all defects by code and can be detailed by all operations.
Note: **Operation names shown here will be taken from the Manage>Operations master list as opposed to the Product BOL name description**
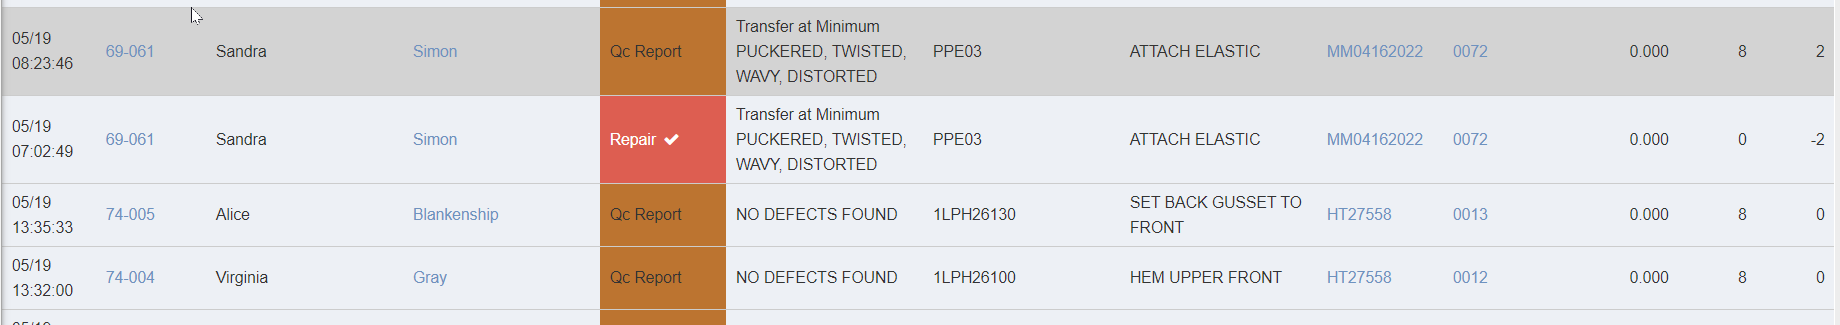
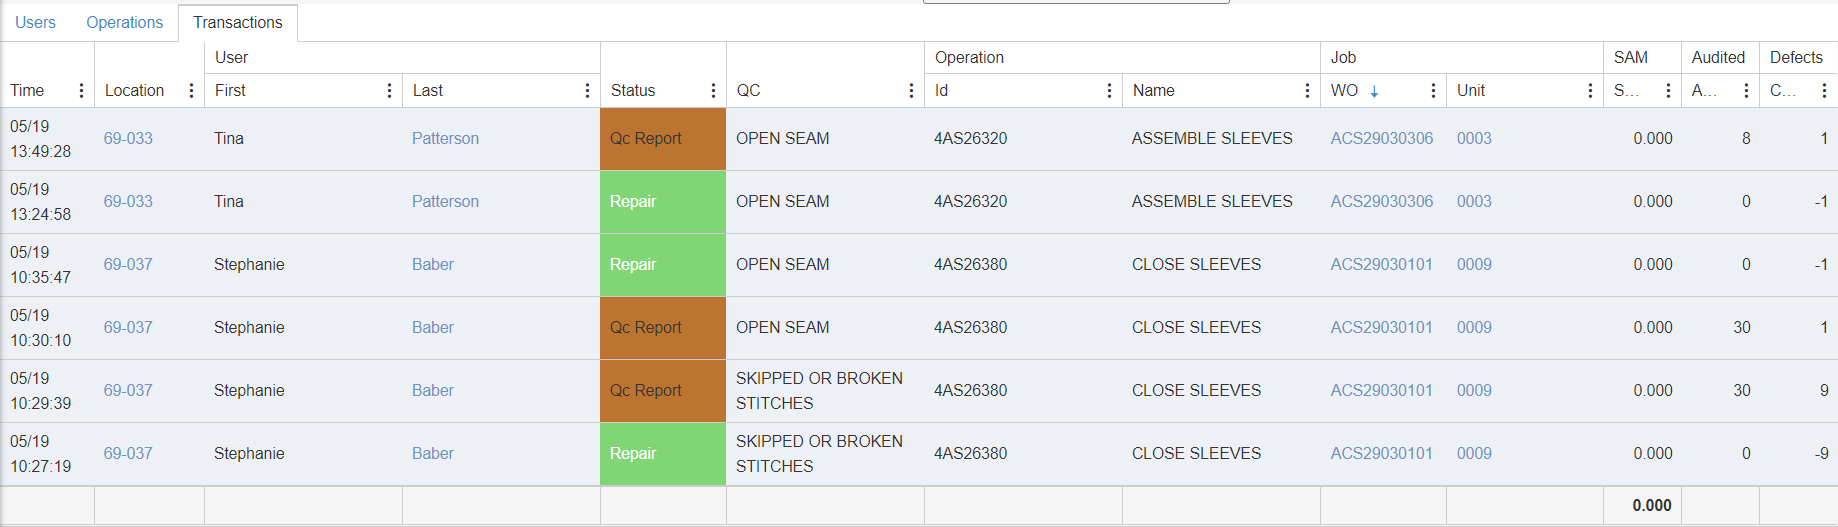
Transactions
Detail information for every transaction reported as a defect, repair, audit sampling and images.
Copyright © 2020 by Aptean. All rights reserved.
Created with the Personal Edition of HelpNDoc: Easily create CHM Help documents