Takttime
Takt Time
Takt Time
Takt time is a industry-accepted method of defining demand over time in a production environment. Information about the concept can be found on this Wikipedia page.
It is defined as follows:
Assuming a product is made one unit at a time at a constant rate during the net available work time, the takt time is the amount of time that must elapse between two consecutive unit completions in order to meet the demand.
Takt time can be first determined with the formula:
T = Ta/D
Where
T = Takt time, e.g. [work time between two consecutive units]
Ta = Net time available to work, e.g. [work time per period]
D = Demand (customer demand), e.g. [units required per period]
Net available time is the amount of time available for work to be done. This excludes break times and any expected stoppage time (for example scheduled maintenance, team briefings, etc.).
Example:
If there are a total of 8 hours (or 480 minutes) in a shift (gross time) less 30 minutes lunch, 30 minutes for breaks (2 × 15 mins), 10 minutes for a team briefing and 10 minutes for basic maintenance checks, then the net Available Time to Work = 480 - 30 - 30 - 10 - 10 = 400 minutes.
If customer demand were 400 units a day and one shift were being run, then the line would be required to output at a minimum rate of one part per minute in order to be able to keep up with customer demand.
Within Shopfloor, Takt time can be defined by team, or by department meaning that if a department is working on a particular product, and that 1 product must be produced every 1 minute, then that equals a Takt time of 1.
- To edit the Takt time for a team, go to MANAGE - USERS - TEAMS.
- To edit the Takt time for a department, go to MANAGER - LOCATIONS - DEPARTMENTS
In both of the above, click the 'edit' button and adjust the Takt time to match your needs or you can use the Takt time calculator by clicking the calculator icon

This screen shows the department settings. The Takt time setting can be edited from here by pressing the 'edit' button and adjusting the number.
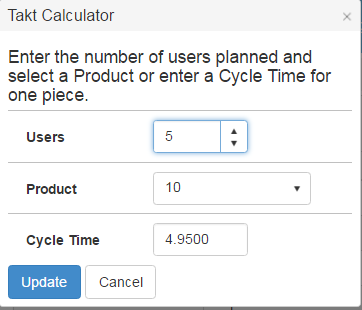
By clicking the grey calculator icon, the Takt calculator window appears and can be used to create the Takt time. Enter the number of users involved in the production, the product, and the cycle time. The calculator will then populate the Takt time setting automatically.
Below is more information within the Shopfloor context:
Looking at the piece count for all operations, it is difficult to quickly understand the output. By not being strategic about the selected operations, the data can be difficult to read could look like. This example only really shows what has been done at spreading and cutting.
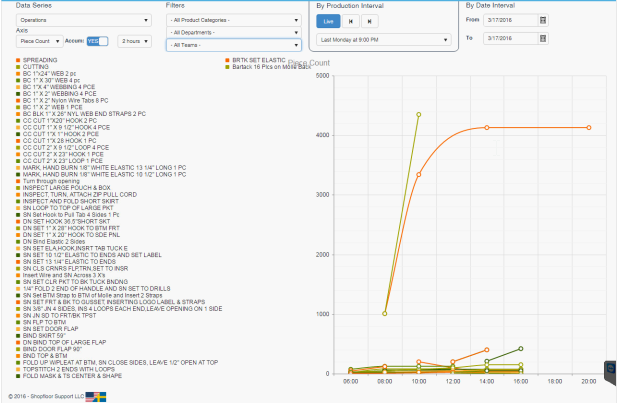
This is of course a pretty normal situation in sewing since the variety of products and operations are wide, so we need to narrow our view. There are a couple of filters that can be used on the target screen to help:
Teams can be used to show what groups of people has produced.
Departments can be used to show what production has been made on groups of locations/tablets.
NOTE the difference here. If a user from the Team Cutting Room “helps out” at an operation in sewing, the production data for those records will still be shown under Cutting Room if using team filtering. If using Departments, data is shown in relation to the location where it was produced (since locations next under departments), that way the production made in a specific department shows there regardless of “who” made it.
But let’s use Teams in this example:
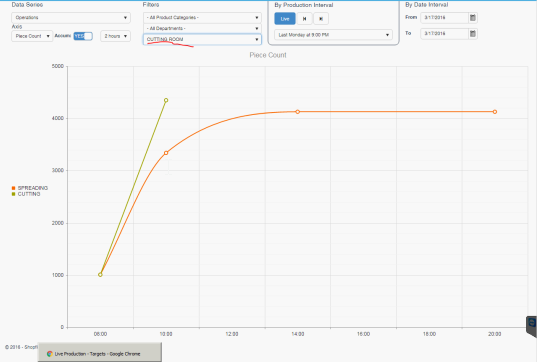
This is CUTTING ROOM, looks pretty OK already since there are only 2 operations.
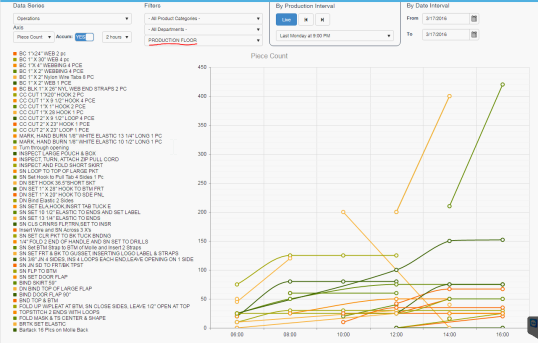
This is PRODUCTION FLOOR, still pretty difficult to get a clear picture since so many operations are visible.
So next step is to identify the operations that are meaningful to measure and represent key markers in the production operation. We need to look for the operations that mark the beginning and end of production:
In many Product definitions, the first operation is marked as WIP start and the last operation is marked as WIP end. This is a good way to be able to track Work orders. See when they have been started and see when they have finished. But in cases like above that last operation might be a Shipping operation that is used when packing and finalizing the shipment and therefor the operation is reported in bulk, every other day or more which skews the picture, It is also possible that the Shipping is done in a different Department than Sewing, that makes it impossible to use for tracking the output of sewing.
Since Shopfloor allows any operation in the operation list to be selected for WIP tracking we can use this to find the common operations that are the last ones to be used in sewing area. In this case it is the inspection operations. So after setting up all operation lists (MANAGE - PRODUCTS - click 'details' on the desired product) with WIP flag on the inspection operation we can use the “Operations WIP” selection in targets - we get this picture:
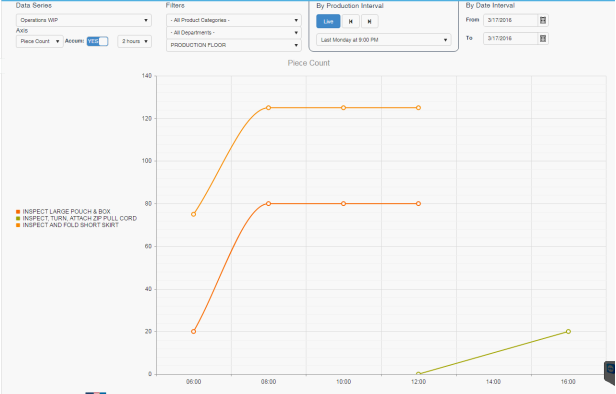
Today there has been 3 different inspection operations used. Probably since there has been 3 different products in production. But we want to have the total output. To achieve that we can setup all the inspection operations to be grouped into the same “Category”. This is done in the Manage Operations section. So after creating an Operation Category “Inspection” and then having mapped all the inspections to this category we get a single line output:
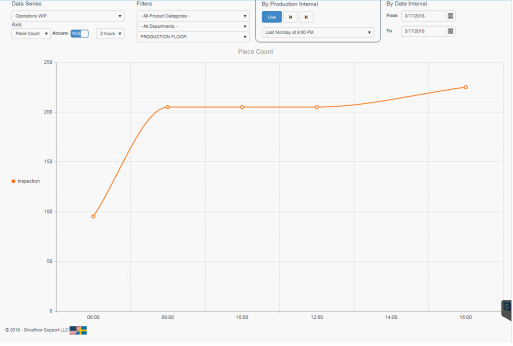
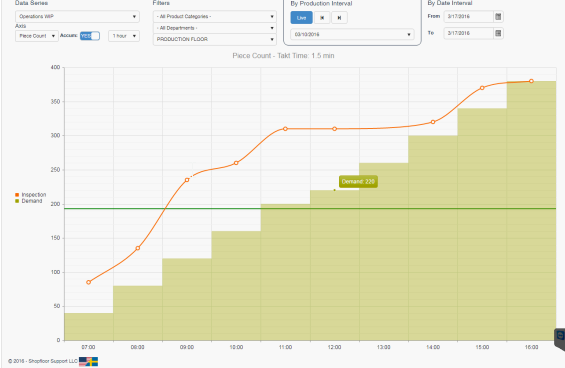
Looking at the Y axis, we can see that 225 pieces have been completed on the production floor on this day. Let's switch to another day and hourly interval to see some more output and look at Takt time.
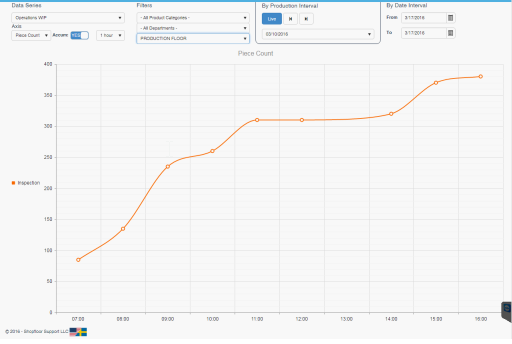
We know that Takt time is defined as the available time (net time) / demand (customer demand) and normally expressed in minutes. So we can use this to compare the output to what number of pieces is required. For example, if we normally work from 07-17 that minus a 30-minute break, that is 570 minutes in the working day and if today’s target for production is 380 pieces, the takt time is 570 minutes/380 units = 1.5 minutes, in other words 1 piece should be finished every 1.5 minutes, so we must set that time for our team (Takt time can also be defined for Departments)

Now if we go back to the target screen we have this:
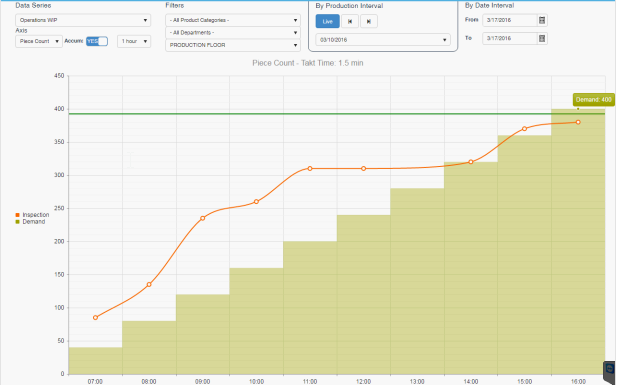
But what’s that? The Demand ends at 400, we missed by our goal 20 pieces. In this case we forgot to schedule the break
Let's go to MANAGE - SCHEDULES and add a 30-minute break at 12:00
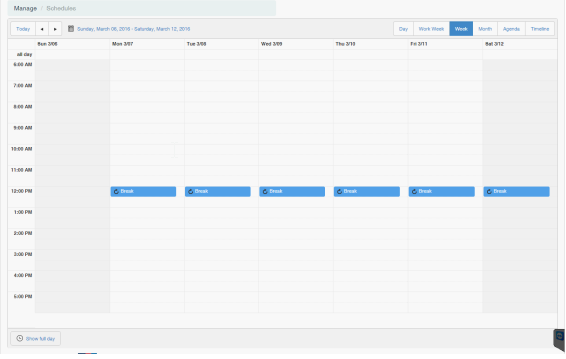
That's better. Notice how the demand only increases by 20 pieces at the interval between 12 and 13, indicated by the smaller green step.
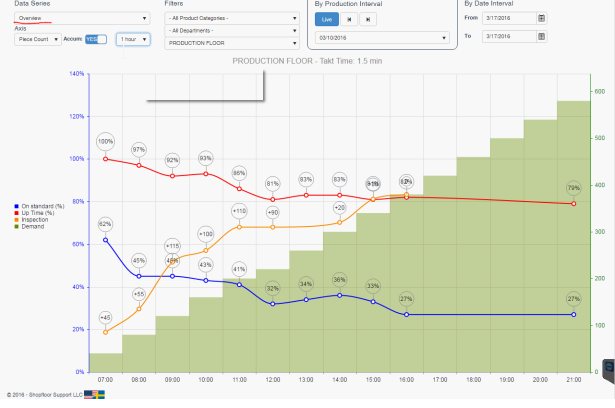
Finally, we can use the “Overview” to plot both the output from the sewing area together with On-Standard Efficiency % and Up Time % in the same graph. The % relates to the left Y-axis and the counts relate to the right Y-axis. The time scale in this one is erroneously extended to 21:00 since one or two operators forgot to sign out. Automated sign-outs can also be configured in the 'schedules' section. Still you can see the Inspection line ending up on demand at 16:00.
Copyright © 2020 by Aptean. All rights reserved.
Created with the Personal Edition of HelpNDoc: Transform Your CHM Help File Creation Process with HelpNDoc